Requirements Specification
Data Flow Diagrams
Network Device Display System
Requested by: Mr. Ken Swarner
Senior Systems Administrator
Mr. Eric Crossman
Orion Technologies
Prepared by: Aleksandr Spektor
Kevin Marsteller
Nicholas Hogan
Christopher Vincek
September 21, 2007
Table of Contents:
Requirements Specification
Data
Flow Diagrams
1.3.1 Data Flow Diagrams
1.3.2 Key
1.3.3 Context Diagram
1.3.4 Level 0 Diagram
1.3.5 Level 1: Manage User Request (1)
1.3.5 Level 2: Select Floor Plan (1.2)
1.3.7 Level 3: View Room (1.2.1)
1.3.8 Level 4: Access Edit Mode (1.2.1.2)
1.3.9 Level 5: Move Device (1.2.1.2.1)
1.3.10 Level 1: Access Control Panel (2)
1.3.11 Level 2: Browse Users (2.1)
1.3.1 Data Flow Diagrams
A data flow diagram shows a
graphical representation of the flow of data within a system. Data Flow
Diagrams utilize four basic symbols (outlined in the next section) to represent
the structure, movement and interaction among the users, data, processes, and
data store. The data flow diagrams for the
1.3.2 Key
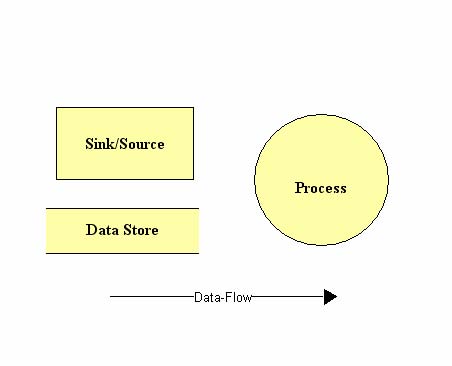
There are four major
symbols used in the data flow diagrams. Closed rectangles represent a sink or
source, which is an outside entity accessing the system. Circles represent the processes
within the system. Open-sided rectangles represent data stores, which, in the
case of the
1.3.3 Context Diagram
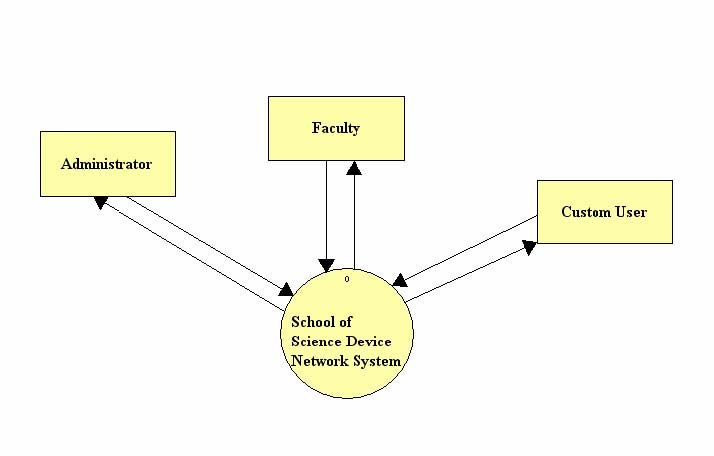
The context diagram is the most basic data flow diagram that shows interaction between the system and the users.
1.3.4 Level 0 Diagram
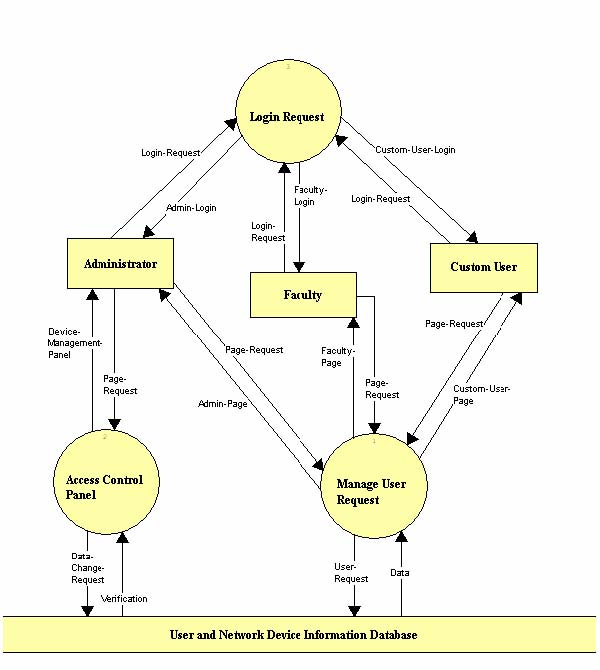
The Level 0 diagram is an
expansion of the
1.3.5 Level 1: Manage User Request (1)
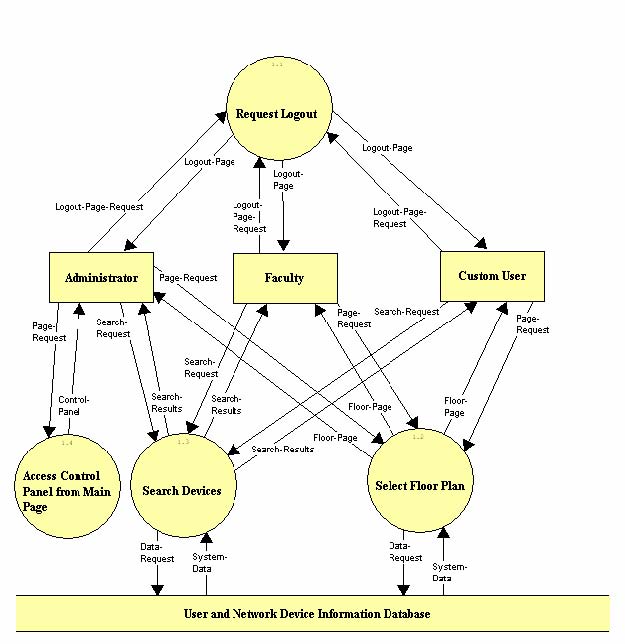
The Manage User Request
diagram outlines the options the users have after logging in to the system. All
users can search for existing devices and select a floor from the
1.3.6 Level 2: Select Floor Plan (1.2)
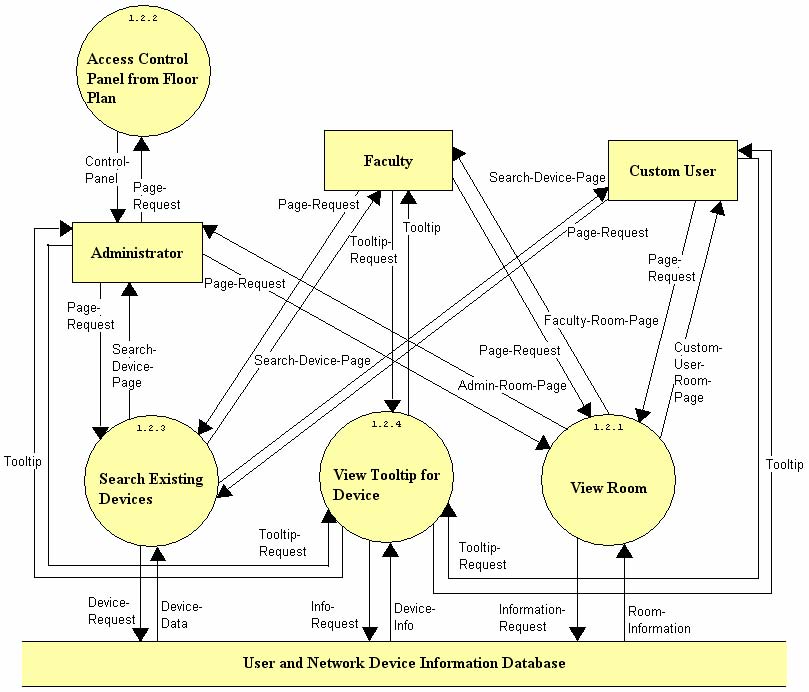
The Select Floor Plan
diagram outlines the options the users have after choosing a floor in the
1.3.7 Level 3: View Room (1.2.1)
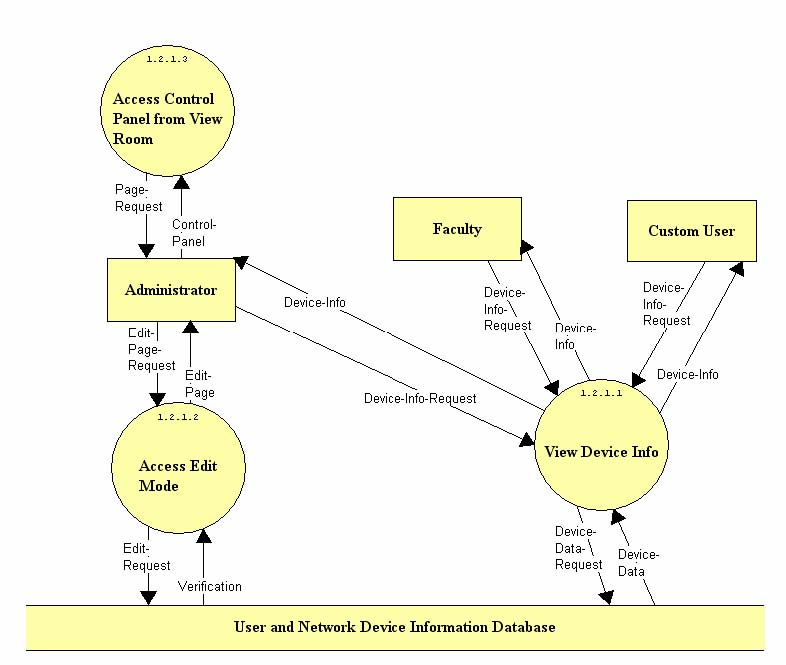
The View Room diagram outlines the options the users have after choosing a room to view. All users can select a device and view information about that device, depending in their user permissions. Administrators call also access Edit Mode, as well as access the Control Panel.
1.3.8 Level 4: Access Edit Mode (1.2.1.2)
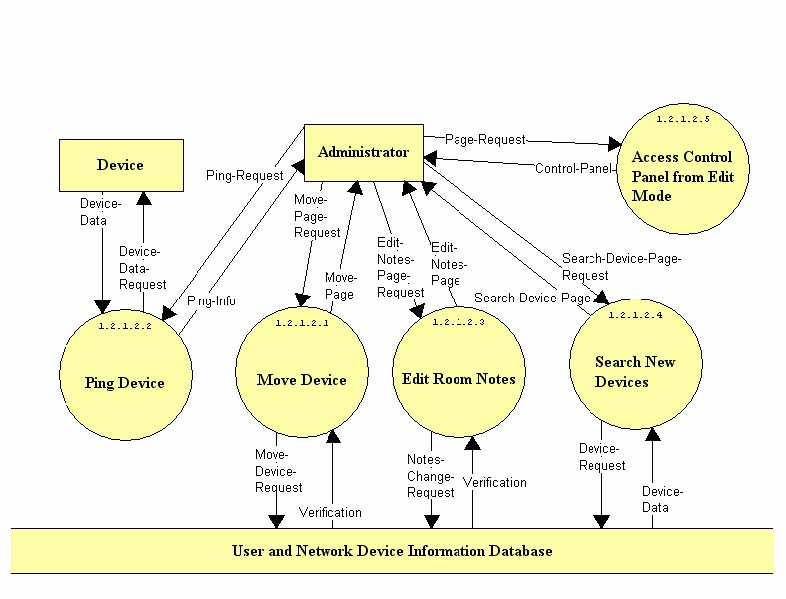
The Access Edit Mode diagram shows the functions available to the Administrator after they enter Edit Mode from the room view. The Administrator will be able to ping a selected device, as well as edit room notes that only the Administrator can see, and search for new devices that have not yet been placed. The Administrator will also be able to move devices located in the room, and access the Control Panel from the Edit Mode.
1.3.9 Level 5: Move Device (1.2.1.2.1)
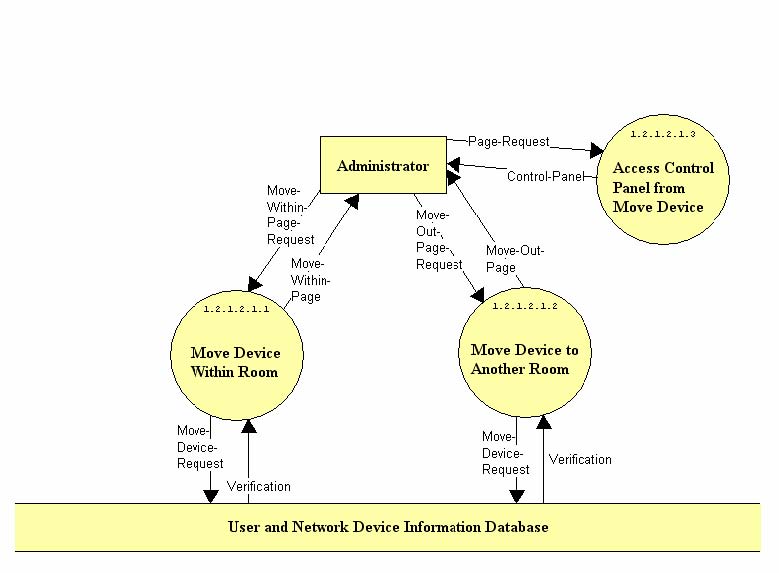
The Move Device diagram shows what functions are available to the Administrator after selecting Move Device. The Administrator will be able to move the selected device within the current room, as well as move the selected device to another room within the building. The Administrator will also be able to access the Control Panel.
1.3.10 Level 1: Access Control Panel (2)
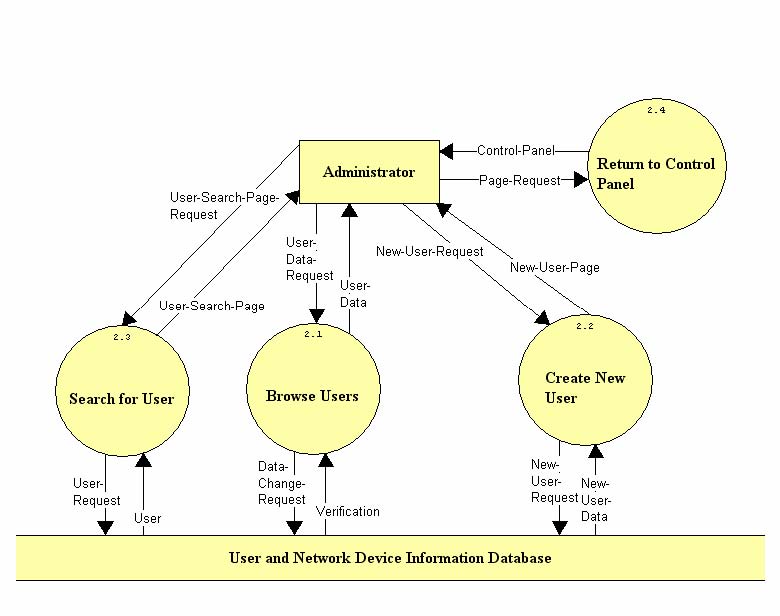
The Access Control Panel diagram outlines the functions available to the Administrator after accessing the Control Panel. The Administrator will be able to browse all users currently in the system, as well as search for a specified user. The Administrator will also be able to create new users and return to the Control Panel.
1.3.11 Level 2: Browse Users (2.1)
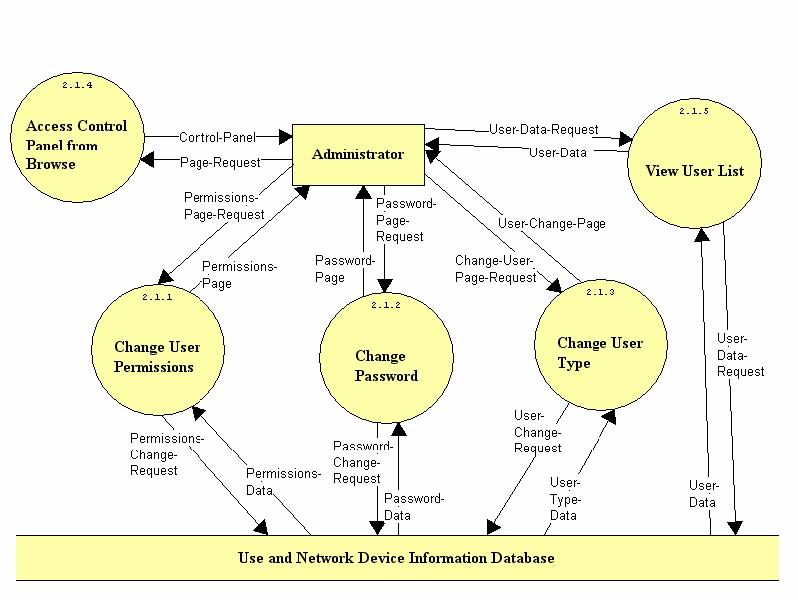
The Browse Users diagram outlines what functions the Administrator will have access to after browsing the current users. The Administrator will be able to change both the permissions and password of any user selected. The Administrator will be able to change the user type of the selected user. The Administrator will be able to browse the list of current users again, and will also be able to return to the control panel from the Browse Users page.