Preliminary Design
Smart Scheduling
Requested
by:
Dr.
Robert Yoder
Computer
Science Department Head
Siena
College
Department
of Computer Science
Prepared
by:
Empire Unlimited
Thomas
Mottola
Jonathan
Smith
Jason
Czajkowski
Brian
Maxwell
Meghan
Servello
Colliln
Lefeber
December 8,
2010
Smart Scheduling
Preliminary
Design
Table
of Contents
1.3 Functional Requirements Inventory
1.4 Non-Functional Requirements Inventory
2.1.1 Data Flow Diagram Legend
2.1.4 Level 1 Diagram: Modify Schedule
2.1.5 Level 1 Diagram: View Report
2.1.6 Level 1 Diagram: Authenticate
2.1.7 Level 1 Diagram: Add Office Hours
2.1.8 Level 1 Diagram: View Schedule
2.1.9 Level 2 Diagram: Modify Class
2.1.10 Level 2 Diagram: Load Previous Schedule
2.2.2 Structure Diagram: Add Office Hours
2.2.3 Structure Diagram: Authenticate
2.2.4 Structure Diagram: Modify Schedule
2.2.5 Structure Diagram: View Report
2.2.6 Structure Diagram: View Schedule
2.3.1 Activity Diagram: Add Office Hours
2.3.2 Activity Diagram: Authentication
2.3.3 Activity Diagram: Modify Schedule
2.3.4 Activity Diagram: View Report
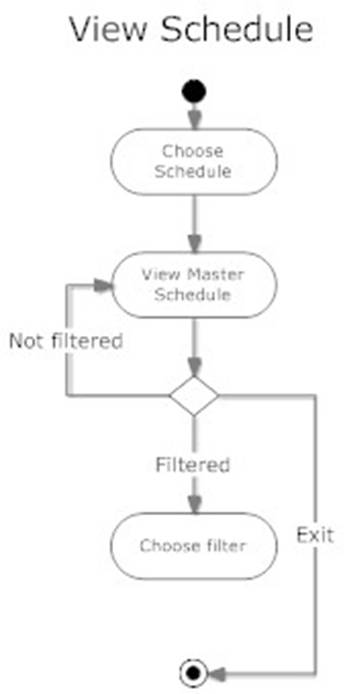
2.3.5 Activity Diagram: View Schedule
2.5.1 Main Template with Labels
2.5.2 Login View - Blank (with template outlines)
2.5.4 Schedule View – Single Day
2.5.5 Schedule View – Day View - Filter Example
2.5.6 Schedule View – Filter Example – All Filtered
2.5.7 Schedule View – List View
2.5.8 Schedule View – List View – Quick Editing
2.5.9 Schedule View – Sorting Example
2.5.10 Resource View – Management
2.5.11 Schedule View – Week View
2.5.12 Resource View – Viewing a Resource
2.6.1 Acceptance Criteria and Testing Plan
2.6.3.1 Directory of Unit Test
2.7 Development Environment and Production Environment
Appendix B: Project
Timeline: Gantt Chart
Review
1.1
Product Overview
Convenience
is of the utmost importance in today’s world.
Dr. Yoder is looking for a product that can deliver this same experience
in regards to his management of the Siena College Computer Science Department
class schedule. Scheduling is currently
done by hand and is extremely cumbersome, so our product (Smart Scheduling)
seeks to apply the speed and automation of today’s technology with the
flexibility of an internet application.
The product will aim to provide a convenient and familiar calendar-like
interface that Dr. Yoder can use easily and efficiently to plan the use of the
department’s resources. Other users like,
students and faculty. would also be able to take advantage of the Smart
Scheduling software by being able to view current semester schedules to
facilitate their own plan making should they need a room.
1.2
User Case Narratives
Course Coordinator/Administrator:Course Coordinators will have the
ability to log into the system via a unique username and password. System is
defined as our (Empire Unlimited) application called Smart Scheduling. Once
logged in, the Course Coordinator will have the ability to create new or edit
existing schedules. The Course Coordinator will be able to assign classrooms,
courses, and faculty in the schedule. The Course Coordinator will have access
to a database of past schedules which may be viewed or used as a template for a
new schedule. The Course Coordinator will have the ability to view reports on
classroom use and Faculty schedules.
The Course
Coordinator is responsible for creating and managing schedules, and will submit
them to the School Dean and all Faculty members for approval and viewing,
respectively.
Faculty:
Faculty will have access to the system via a unique username
and password. Faculty can view all schedules submitted by the Course
Coordinator, as well as be able to view classroom and Faculty reports. Faculty will have the ability to add office
hours and other meetings to their own schedule.
General User:
General Users will have access to the system without any
authorization. General users will be
able to view faculty and classroom schedule reports. A general user will not have any rights to
modify or add to a schedule.
In addition to being
able to view faculty and classroom schedule reports, schedules will be printed
out, and posted outside of classrooms and faculty offices. This will enable
everyone, mostly general users, to see at a quick glance which classrooms are
being used by which teacher.
1.3
Functional Requirements Inventory
Smart
Scheduling will be able to run on all popular browsers including but not
limited to: Internet Explorer, Mozilla Firefox, as well as Google Chrome.
The
following is the functional requirements for each user. The requirements are
grouped by the user; there are 3 users for Smart Scheduling.
Course
Coordinator
·
Will
be able to find common time slots to schedule departmental meetings or new classes.
·
Will
be able to modify the schedule.
o
Will
be able to delete previous schedules.
o
Will
be able to delete classes
o
Will
be able to modify classes.
·
Will
be able to add new classes.
·
Will
be able to securely log into the system using a registered username and
password.
·
Will
be able to view the current schedule.
o
Will
be able to filter the schedule by professor(s).
o
Will
be able to filter the schedule by classroom(s).
·
Will
be able to create a faculty account, where faculty will be able to access the system.
·
Will
be able to view and print room reports.
Faculty
·
Will
be able to securely log into the system using a registered username and
password.
·
Will
be able to view the current schedule.
o
Will
be able to filter the schedule by professor(s).
o
Will
be able to filter the schedule by classroom(s).
·
Will
be able to view and print room reports.
·
Will
be able to add office hours or other meeting, where they will be available in order
to meet with students or fellow teachers.
General
User
·
Will
be able to view and print room reports.
·
Will
be able to view the current schedule.
o
Will
be able to filter the schedule by professor(s).
o
Will
be able to filter the schedule by classroom(s).
This list is
subject to change as more information is gathered about the project.
1.4
Non-Functional Requirements Inventory
The
non-functional requirement inventory is a list of non-functional system
requirements. This list is composed of requirements that specify how the system
should be. This list is subject to
change as more information is gathered about the project.
·
The
system will be easily maintained.
·
The
system will be stable.
·
The
system will be viewable on multiple browsers.
·
The
system will be efficient.
·
The
system will be user friendly and easy to use.
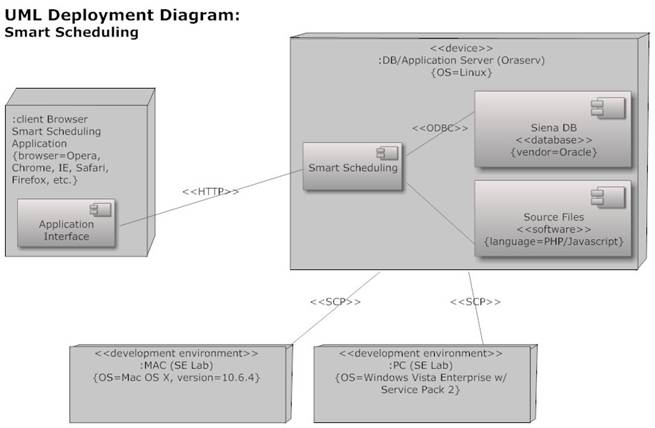
1.5
UML Deployment Diagram
Deployment Diagrams are a Unified Modeling Language (UML)
based diagram used to show devices and execution environments for a
system. It represents the physical layout of the System.
![]()
1.6
Framework Tree
For Smart Scheduling we anticipate
using a web framework as opposed to pure
server side (PHP) code. A framework
operates on a few conventions that allow our code to be reusable and well
organized.
Most modern frameworks use a Model
View Controller (MVC) philosophy to organize code into logical groups which
makes it easier for the programmer to find, write, reuse, and manage their
code. Models interact with the database
with queries, views contain page layouts and templates while the controller
puts the two together into a cohesive page by calling the model and passing the
data down to the view. Therefore a
traditional html file web map would not be sufficient to describe such
behavior, because the actual files will be organized differently and in a way
we cannot predict.
A more useful map of our project
would be focused on the views because the user directly interacts with
them. As mentioned before views serve as
templates for different sections of the Smart Scheduling system. The following tree should help diagram how
the site will be laid out by showing views in a tree-like view.
In terms of diagramming the system’s functionality along with
this tree view like a web map, our functional requirements inventory already
parallel the views.
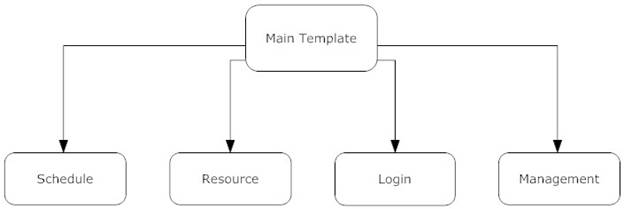
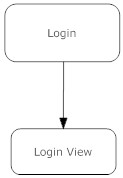
The above
image shows the highest level of our view structure. The user will access pages through the main
website template that will retain a common header (among other elements) while
altering the main body of the page. We
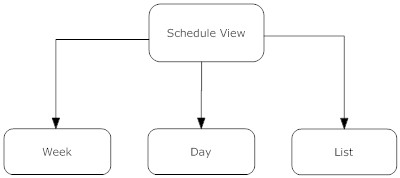
anticipate there should be multiple ways to view:
- The Schedule
- Viewed by week, day, or list format
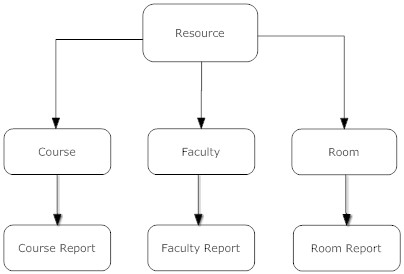
- Resources
- Viewing of an individual faculty member, course,
or room
- Login
- Logging in
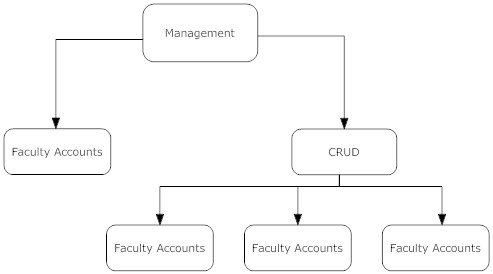
- Management
- Coordinators view of updating each resource
Schedule Section
Resource Section
Login Section
Management View
Preliminary Design
2.1
Data Flow
Diagrams
The purpose
of Data Flow Diagrams is to show the “flow” and transformation of data through
the system. These diagrams are used as a
visualization tool to help the audience get a better idea of what exactly is
going on in the system. The first image
shown below will be a legend describing what each of the different items in the
diagrams are and what they represent. A
Context Diagram is shown next, which is the general overview of each of the
different agents interacting with the system.
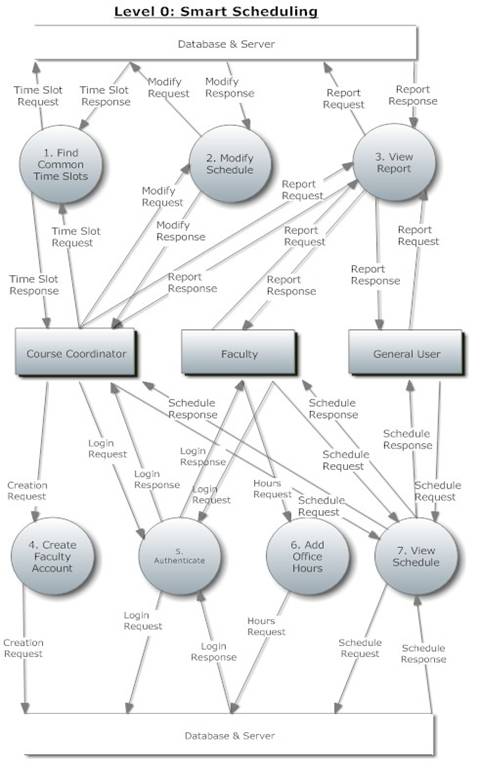
The Level 0 Diagram shows some more details about which processes each
of the agents will be interacting with.
Arrows are drawn to show the flow of data between the agents and
processes. Following the Level 0 Diagram
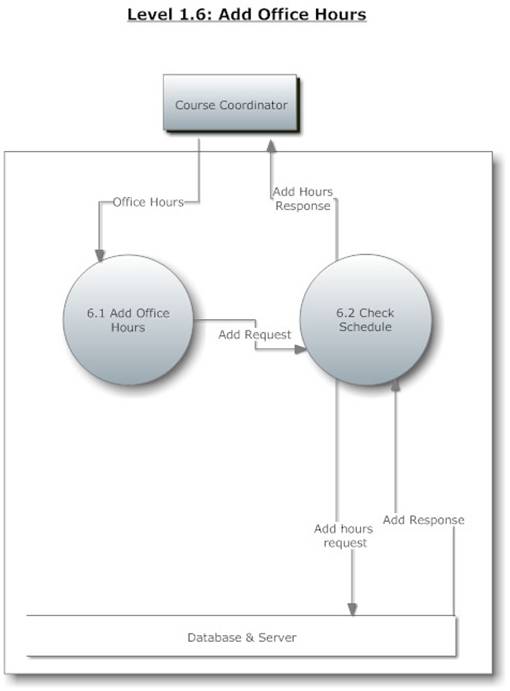
are two Level 1 Diagrams, each for one of the processes of the system. Each Level 1 Diagram shows that individual
process in greater detail and contains labeled arrows to indicate what
information is flowing to and from the processes and agents. Following the
Level 0 Diagram are Level 1 and Level 2 Diagrams. The purpose of these Diagrams is to further
break down each of the processes that are involved with the system. The further
down the level is the more detailed the diagram is.
2.1.1 Data Flow
Diagram Legend
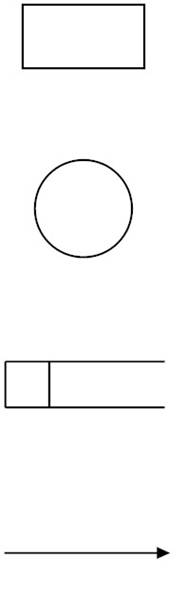
Entities/Sources/Sinks
of the system which represents the users.
Data will flow between these entities.
Processes of the
system which represents the functions.
Data will flow from and to these processes.
Stores of the
system which represent what stores the data.
Data will flow into, be saved and be pulled from these data stores.
The Flows of the
system which represent the chuck or packets of information going from one
component to another.
This is a
legend for the Data Flow Diagrams. This
legend explains all objects used in the diagram and what they represent.
2.1.2 Context
Diagram
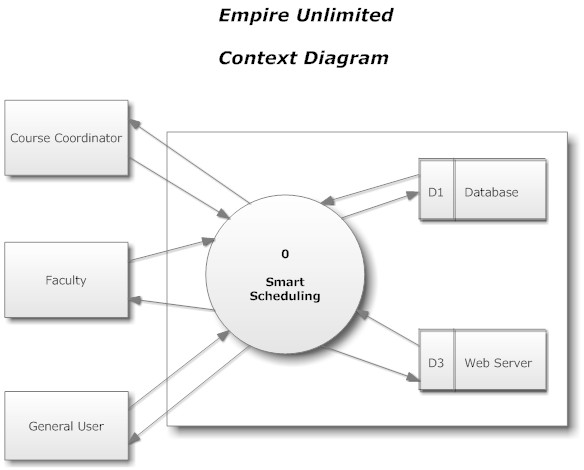
This diagram depicts a broad representation of the entities
of the system and their interaction with the system.
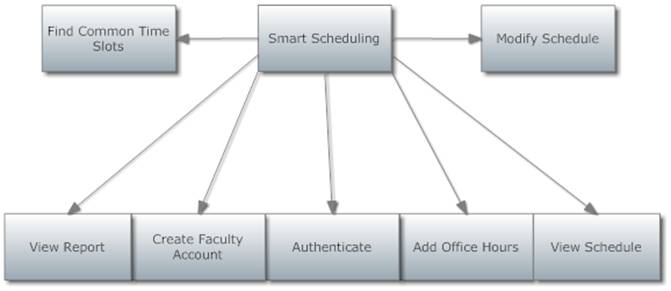
2.1.3 Level 0
Diagram
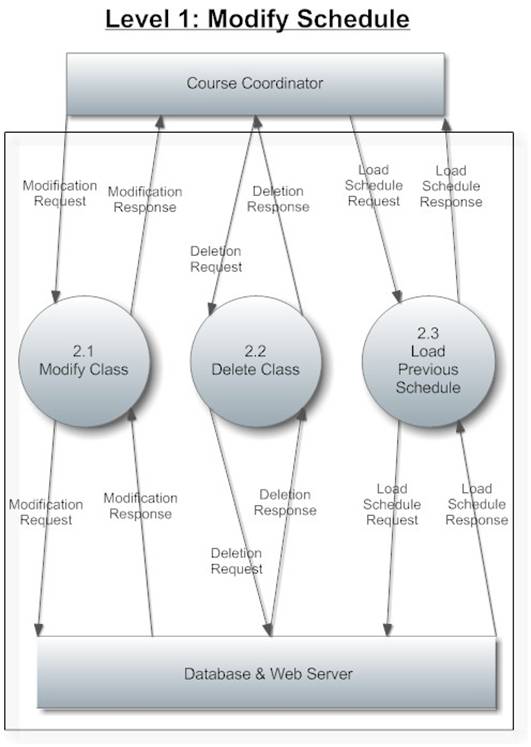
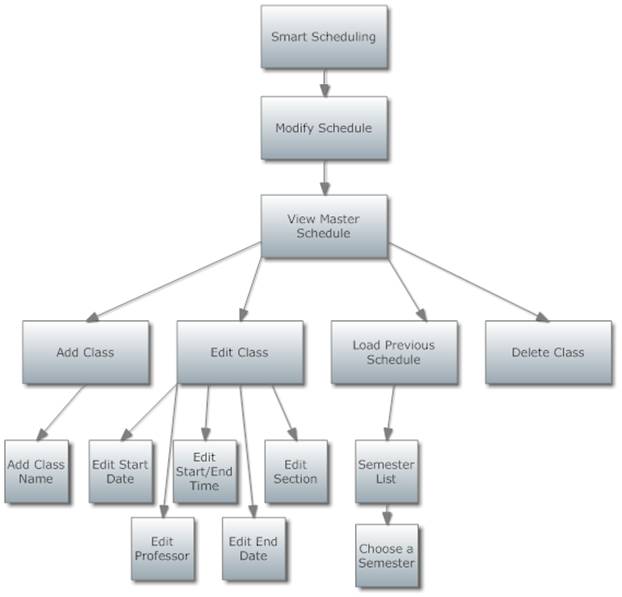
2.1.4 Level
1 Diagram: Modify Schedule
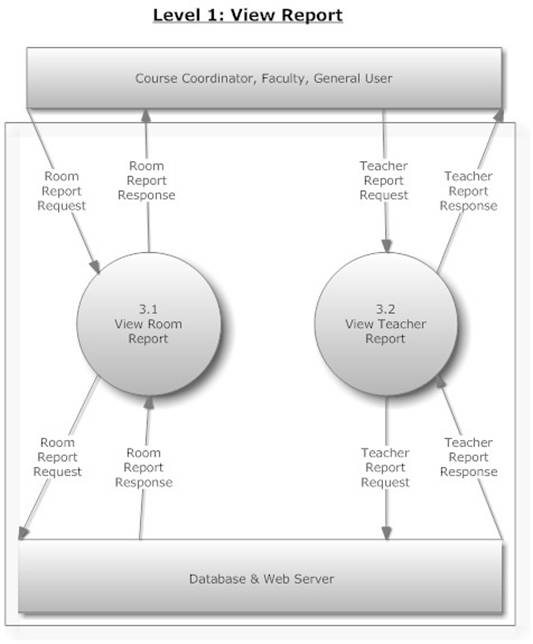
2.1.5 Level
1 Diagram: View Report
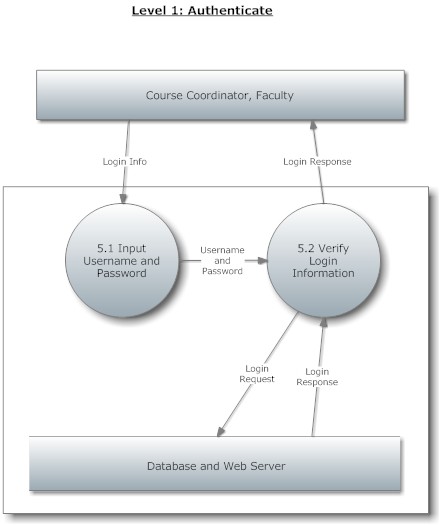
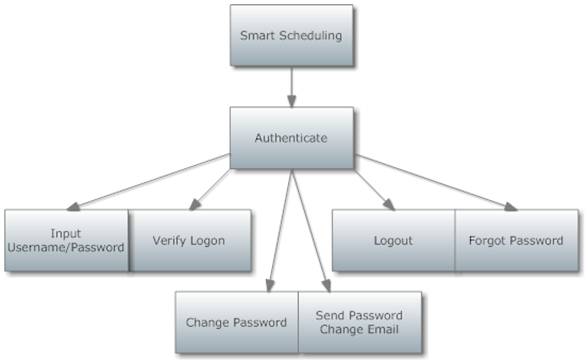
2.1.6 Level
1 Diagram: Authenticate
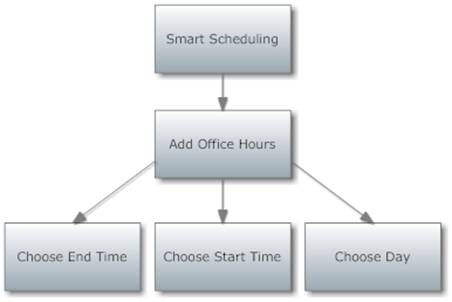
2.1.7 Level
1 Diagram: Add Office Hours
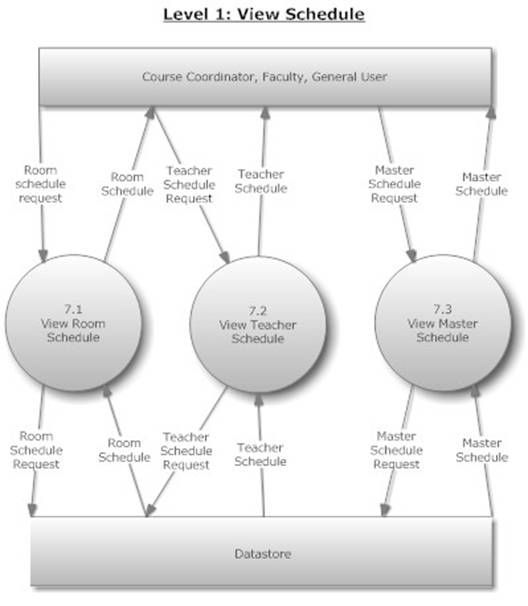
2.1.8 Level
1 Diagram: View Schedule
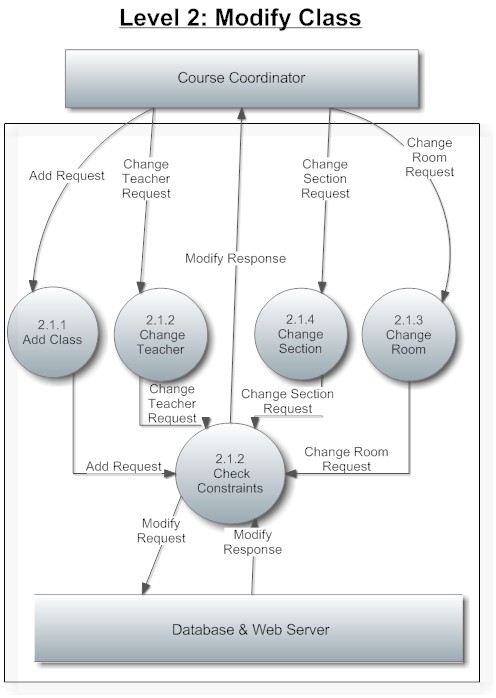
2.1.9 Level
2 Diagram: Modify Class
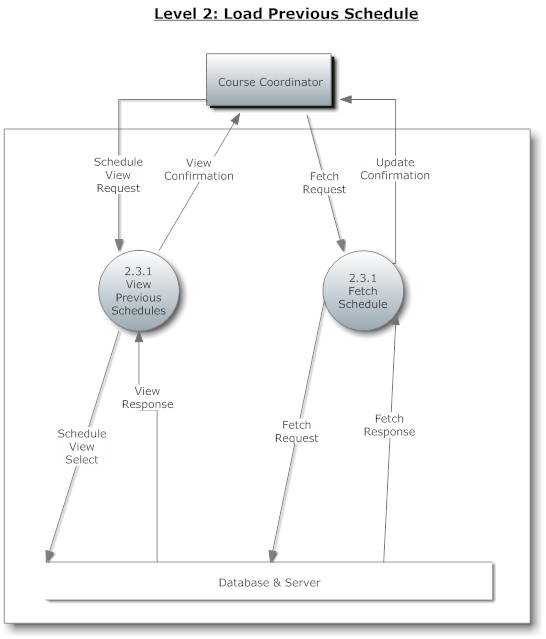
2.1.10
Level 2 Diagram: Load Previous Schedule
2.2
Structure
Diagrams
A Structure Diagram in software engineering is a diagram, which shows the breakdown of the configuration system to the lowest manageable levels. It is used to show the hierarchical
arrangement of the modules in a structured
program. Each rectangular box represents
a module. The names of the modules are written inside the box, and arrows are
drawn between modules to show relationships.
2.2.1
Structure
Diagram
2.2.2
Structure Diagram: Add Office Hours
2.2.3
Structure
Diagram: Authenticate
2.2.4
Structure Diagram: Modify Schedule
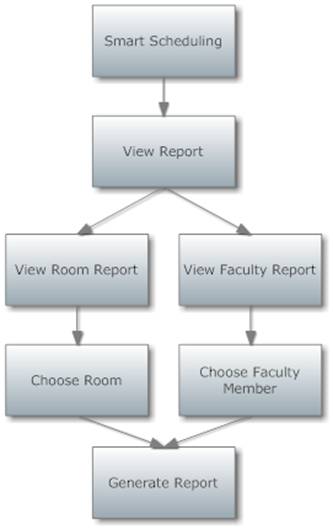
2.2.5
Structure Diagram: View Report
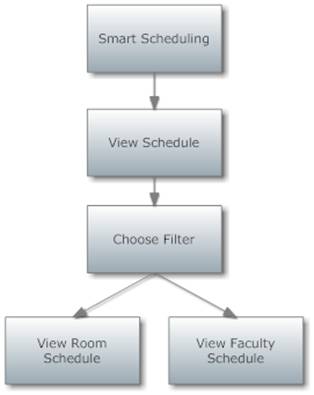
2.2.6
Structure
Diagram: View Schedule
2.3
UML Activity
Diagrams
Activity Diagrams are a UML (Unified
Modeling Language) specified diagram which shows workflows of stepwise
activities and actions, with support for choice, iteration, and
concurrency. It outlines the process that Actors (both human and
non-human) go through while interacting with the System to accomplish a specific
task.
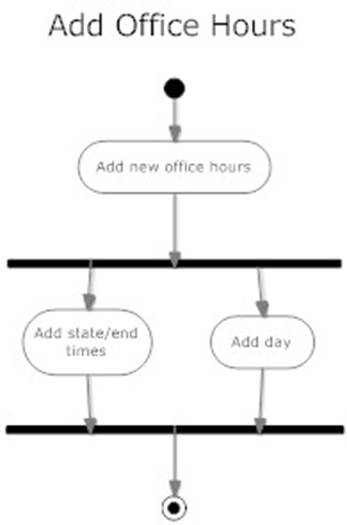
2.3.1
Activity Diagram: Add Office Hours
2.3.2
Activity Diagram: Authentication

2.3.3
Activity Diagram: Modify Schedule

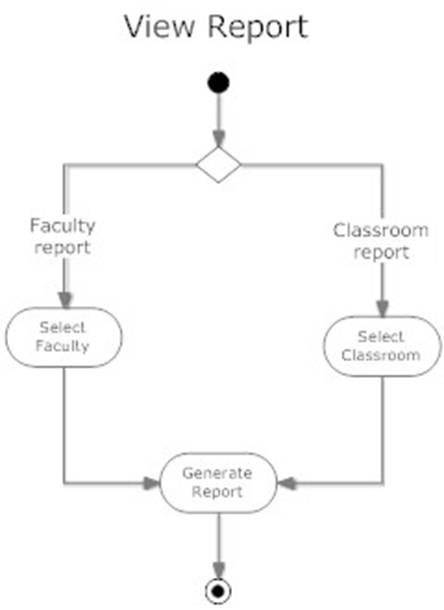
2.3.4
Activity Diagram: View Report
2.3.5
Activity Diagram: View Schedule
2.4
Logical Data
Dictionary
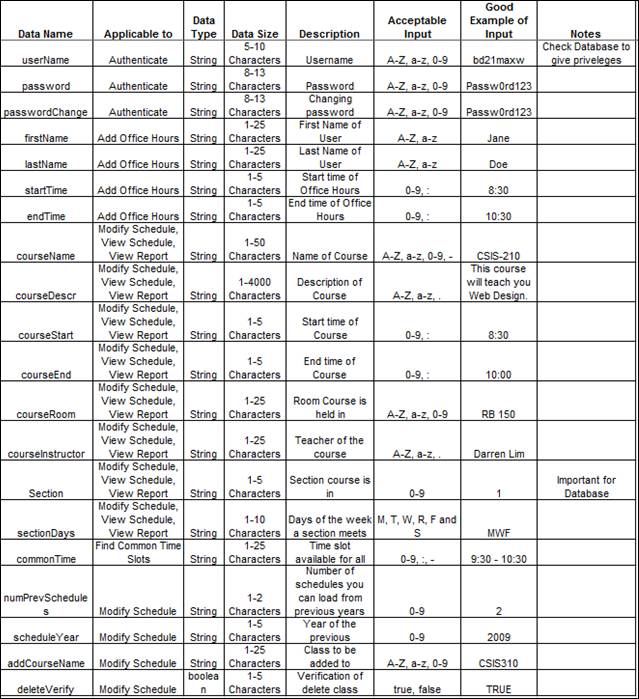
Definition
of a Data Dictionary: a
"centralized repository of information about data such as meaning,
relationships to other data, origin, usage, and format." - IBM Dictionary of Computing.
KEY:
Data Name: The name of the data entity being stored,
whether it be in a database or
not.
Applicable To: The screens that this data entity will be
used for.
Data Type: The type of data for a data entity
Data Size: The size of the data in terms of it's data
type.
Description: A description of
what data this entity is storing.
Acceptable Input: What must be
inputted by a user in order for the system to accept the data.
Correct Example of Input: An
example of data that would be accepted by the system.
Notes: Additional information
regarding the data.
Below is a list of all data types
available.
2.5
Prototypes
The format for listing our
prototypes will be as follows:
·
An
image showing some key functionality we wish to highlight.
·
A
bulleted list listing what the page displays (and might display as design
changes).
·
A
description or clarification of elements in the list or image.
The first prototype will be the Main Template. The main template outlines the major sections of the
website that will be described in the bulleted lists.
It will also serve as an example of how the following
prototypes will be listed.
2.5.1 Main
Template with Labels
Header
·
Logo
·
Right
Menu
o
Top
Menu
§ The main functions that should be
available to each user entering the site.
o
Bottom
Menu
§ Additional options such as
features. Similar to a toolbox.
Main Block
·
Schedule
View
o
How
we will output schedule information
§ Calendar View
§ Giant Course List
·
Create,
Read, Update, Destroy forms
o
Editing
and viewing the data of every resource
§ Reading (Viewing)
·
Display
the values of all the fields and their labels
§ Updating & Creating
·
Provide
a form with all the data fields
·
Populate
with current data if updating
o
Error
messages
§ Displayed under the field
·
Special
Functionality
o
Recalling
past schedules
Footer
·
Copyright
Info
·
Possible
link section on the main page
2.5.2 Login
View - Blank (with template outlines)
Header
·
Logo
·
Right
Menu
o
Top
Menu
§ View Schedule
§ Login (selected)
o
Bottom
Menu
§ None
Main Block
·
Form
View
o
Title
§ Login
o
Fields
§ Username
§ Password
o
Buttons
§ Submit
o
Error
messages
§ Displayed under the field
Footer
·
Copyright
Info
·
Possible
link section on the main page
2.5.3 Login
Screen – Errors
·
Same
layout as the blank login screen.
·
Field
errors appear after form is submitted under their respective field box.
o
These
would occur in alignment with our Unit Test constraints.
o
In
general cases where data is invalid.
2.5.4 Schedule
View – Single Day
Header
·
Right
Menu
o
Top
Menu
§ View Schedule is highlighted
o
Bottom
Menu
§ Links to Class and Faculty management
Main Block
·
Schedule
View
o
Day
Block (left column)
§ Class Items
·
Class
information
o
Selector
Box (right column)
§ Filter categories for Professors,
Classes, Rooms
This is the basic day view of the scheduling system.
It will reflect all changes made to class information.
2.5.5 Schedule
View – Day View - Filter Example
This shows how filters in the right hand column can be
applied to the schedule.
The user will have the ability to click on a colored box to
show/hide highlighting in the schedule.
The user will have the ability to hide and show items that
match the filter with the check boxes.
When a category is contracted (and the user has not made any
changes yet) it is assumed that all items will be shown.
Header
·
Right
Menu – Same as the master day view
Main Block
·
Schedule
View
o
Day
Block (left column)
§ Class Items
·
Class
information
·
Filter highlighting tab (colored
corners)
o
Selector
Box (right column)
§ Filter categories for Professors,
Classes, Rooms
·
Expanded
Professors Category
o
Highlighting
selector (colored boxes)
o
View/Hide
item checkbox
2.5.6
Schedule View – Filter Example – All
Filtered
Header
·
Right
Menu – Same as the master day view
Main Block
·
Schedule
View
o
Day
Block (left column)
§ Class Items
·
Class
information
·
Filter highlighting tabs
o
Selector
Box (right column)
§ Filter categories for Professors,
Classes, Rooms
·
All
sections expanded
o
Highlighting
selector (colored boxes)
o
View/Hide
item checkbox
This shows the ability to filter by multiple different resources.
2.5.7
Schedule View – List View
Header
·
Right
Menu – Same as the master day view
Main Block
·
List
View
o
List
all scheduled classes in a table format
§ CRN
§ Course Title
§ Professor
§ Room
§ Days
§ Start/End Time
o
In
the future links may be included to redirect user to an editing page.
o
Quick
Edit
§ Next prototype
This view can only be accessed by the course coordinator.
The next few prototypes show some of the functionality used
to manage the schedule.
2.5.8
Schedule View – List View – Quick Editing
Header
·
Right
Menu – Same as the master day view
Main Block
·
List
View
o
List
all scheduled classes in a table format
o
Quick
Edit
§ Course highlighted in orange (first
list item) appears in the quick edit box.
§ Coordinator can quickly edit the
item’s details and resubmit it as long as there are no conflicts.
2.5.9 Schedule
View – Sorting Example
Header
·
Right
Menu – Same as the master day view
Main Block
·
List
View
o
List
all scheduled classes in a table format
§ Sorting Arrows
·
Next
to each category. Sorts the rows by the
respective piece of data
o
Alpha
numeric
o
Custom
order (MWF, TR, T, R)
o
Times
A potential way to view the list sorted and highlighted by
the category chosen.
Color management not shown, but could be potentially
implemented.
2.5.10
Resource View – Management
Resources like course, professors, and rooms will need to be
manageable; therefore they should follow a generic template like the one above.
The following is a generic list layout covering all the
potential pages.
Header
·
Right
Menu – Same as the master day view
·
Coordinator
is logged in (R Yoder)
Main Block
·
Title
o
CRUD
Management of Resources
§ Temporary Title
o
New
Resource
§ Replace resource with Course,
Professor or Room
·
When
editing a resource, fields will be populated with their current values
·
New
resources will be blank
·
Field
List for each resource
o
Course
§ CRN - text
§ Room
·
Possible
dropdown with available options
§ Professor
·
Possible
dropdown with available options
§ Times – Start End
·
Possible
dropdown with available options
o
Professor
§ First Name – Text
§ Last Name – Text
o
Room
§ Room Number
·
Error
messages due to conflicts or improper data will appear on the edit page. Preferably under the suspect field, but might
also be compiled in a box above or below.
This is meant to be a generic layout for the backend CRUD
system. CRUD stands for create, read,
update, delete. For each of our
resources we will need to be able to edit the values of each entry and create
new ones.
The user will be able to come to a crud page either by
clicking on a resource (ex. Dr. Flatland) which would allow them to edit the
details of that professor.
You could also come to a crud page from a ‘create new’ link
when a new professor, course, or room needs to be added.
All of these pages will have the same generic structure,
field labels with the actual fields and a confirm button.
2.5.11
Schedule View – Week View
Header
·
Right
Menu – Same as the master day view
Main Block
·
Title
o
Week
Schedule
o
Week
start day (Monday the first in this example)
·
Week
View
o
List
all scheduled classes in a table format
§ Items listed in time block groups
§ Blocks can be expanded to view detail
·
User
can then click on an item to view details (course number could link to day of
week)
2.5.12
Resource View – Viewing a Resource
Header
·
View
Schedule highlighted
Main Block
·
Title
o
Resource
Management or other main title
o
Name
of resource
§ Faculty name
§ Room Number
§ Course Number
·
Generate
Report
o
Directs
you to a printer friendly format of that specific resource’s weekly schedule
·
Data
o
The
field names as they apply to resources
§ First name
§ Last name
§ Room Number
§ etc
o
The
values of the fields
§ Names
§ Room Numbers
§ Times
§ Etc
2.6
Test Plan
2.6.1
Acceptance Criteria and Testing Plan
A software project test plan is a document that
describes the objectives, scope, approach, and focus of a software testing
effort. The
process of preparing a test plan is a useful way to think through the efforts
needed to validate the acceptability of a software product. The completed test plan will serve to help anyone that
is not involved in the testing to understand the ‘why’ and ‘how’ of product
validation. The test plan documents the approach
that will be used to authenticate and make certain that a product or system
that is being tested meets the requirements and other conditions.
The acceptance criteria will be determined by the functional
requirements inventory listed in section 1.3 of this document and the
non-functional requirements inventory listed in section 1.4 of this
document. By definition, functional requirements are what the system will
be able to do and what is testable about the system while in contrast, the
non-functional requirements define how the system will be; the elements of the
system that are not testable. At the completion of this project,
team Empire Unlimited will determine which of these requirements were met and
which were not met. Please refer to the sections listed above, functional
and non-functional requirements, to see the complete listing but keep in mind
that these requirements are subject to change and can be added to as more
information is gathered.
Smart Scheduling will be tested on both Windows and Mac operating
systems and with the four major browsers Internet Explorer 7 and 8, Mozilla
Firefox, Safari and Google Chrome.
Testing requirements will be decided upon and developed by Empire Unlimited. The first set of tests will be a set of
individual unit tests that will break the system down into separate
modules. Each individual unit of the
module will be tested separately from every other unit and module. Once it has been determined that each
individual unit works correctly, the module test will be performed, which will
test all units of that module together.
Next the integration test will be preformed. This test will bring all the modules together
to be tested and make sure they run properly.
The system test will be a combination of all tests. This will connect all of the units and
modules and bring the entire system back together to be tested further as one
whole entity. In the next document, the
Detailed Design, tests will be written out for each unit and then the results
of all of these tests will be presented in the Acceptance Test document where
it will be determined whether or not all requirements were met.
2.6.2
Unit Test Directory
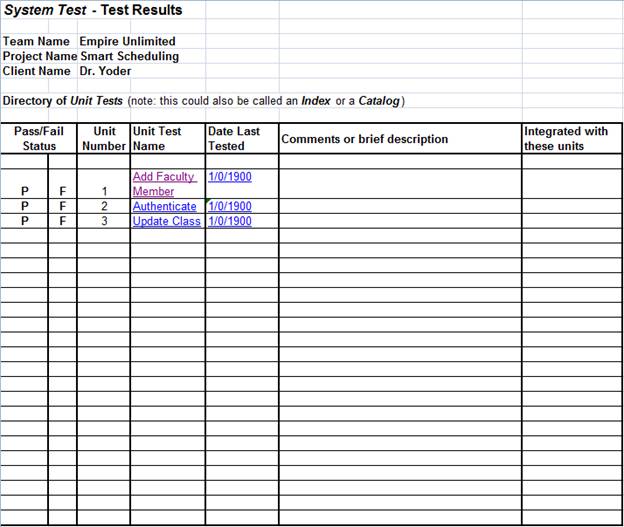
The
following is a list of all separate units that will be tested. Once each of
these unit tests passes, a full system test will be performed to ensure
correctness and efficiency.
List of Units
Add
Faculty member
Authenticate
Update
Class
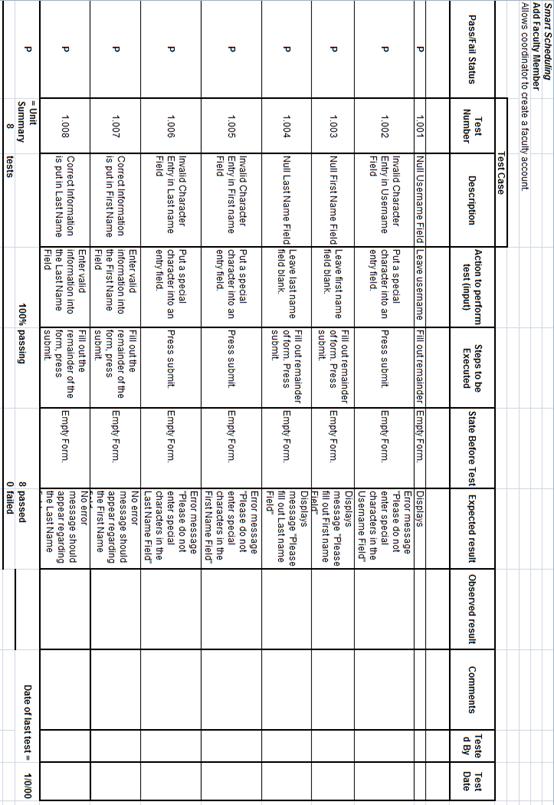
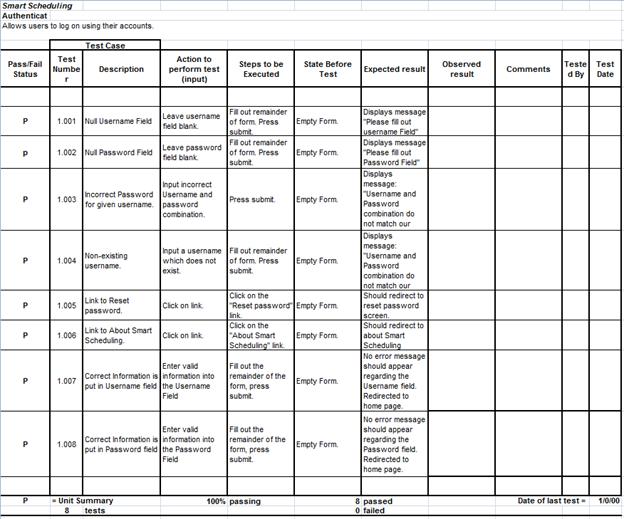
2.6.3
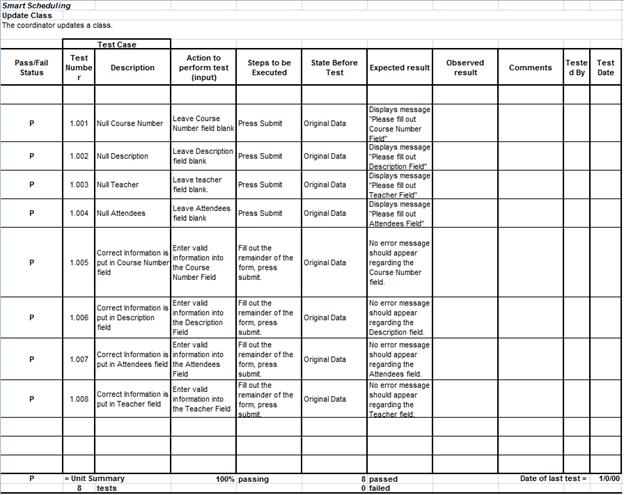
Unit Test Cases
A test case includes
the test number and description of the test.
The action to be performed, or the input entered by the user, the state
before the test, and the expected result are described for the three units
below. There are cases described for the
correct actions of users as well as incorrect actions. After the tests have actually been performed,
the observed results will be recorded.
2.6.3.1
Directory of Unit Test
2.6.3.2
Add Faculty Member
2.6.3.3
Authenticate
2.6.3.4
Update Class
2.7
Development
Environment and Production Environment
For our
development environment, Empire Unlimited will be using the Windows and
Macintosh computers provided by Siena College located on the 3rd floor of Roger
Bacon in the Software Engineering lab.
The reason for detailing the development and production environments is
to try and complete a high level of compatibility across as many platforms as
possible. If an error in compatibility
arises, this listing will act as a reference to help narrow down potential
version conflicts.
Server
Web Server: Apache version 2.2.9
Programming Language: PHP version 5.2.6
Database: MySQL 5.0.45
Windows
Machine:
· Operating System:
Microsoft Windows Vista Enterprise (32 bit)
v
Service Pack
2
· Hardware
v
Processor:
Intel Core 2 Duo, 2.93 GHz
v
Memory: 4.00
GB RAM
· Software
Installed:
v
Microsoft
Office 2007
v
Macromedia
Dreamweaver : Version 7.0.1
v
Macromedia Fireworks : Version 7.0.2.295
v
Internet
Explorer : Version 9.0.7930.16406
v
Mozilla
Firefox : Version 3.6.12
v
Google
Chrome : Version 7.0.517.44
Macintosh
Machine:
· Operating System:
Apple Mac OS X
·
Version
10.6.4
· Model: iMac5
· Processor: Intel
Core2 Duo
·
Speed: 2 GHz
· Memory (RAM):
1.00 GB
Appendices
The
information presented in this document was gathered through meetings held with
the client, Dr. Robert Yoder.
Information was also taken from class lectures held with Dr. Lederman
and from documents written by past Software Engineering groups.
Appendix A: Glossary of Terms
Ajax (Asynchronous JavaScript and XML) - A group of web development
techniques used on the client-side to create interactive web applications.
Apache HTTP Server (Web
Server) - Referred to as Apache, it is web server software notable for
playing a key role in the initial growth of the World Wide Web.
Cascading
Style Sheets (CSS)
- A style sheet language used to describe the presentation semantics (the look
and formatting) of a document written in a markup language.
Chrome – Internet browser designed by Google.
Conflict and Constraint – When an activity can’t be scheduled
due to room use, weekend, and one resource being currently in use.
Database
- An organized collection of data for one or more uses, typically in digital form.
Dreamweaver – A web development application.
Dropbox - A Web-based file hosting service
operated by Dropbox, Inc. which uses cloud computing to enable users to store
and share files and folders with others across the Internet using file
synchronization.
Firefox – Internet browser designed by Mozilla.
Gantt
Chart - A type of
bar chart that illustrates a project schedule. Gantt charts illustrate the
start and finish dates of the terminal elements and summary elements of a
project.
HTML ( HyperText Markup Language) -
The predominant markup language for web pages. It is written in the form of
HTML elements consisting of "tags" surrounded by angle brackets
within the web page content. It is the building blocks of all basic websites.
Internet
- A global system of
interconnected computer networks that use the standard Internet Protocol Suite
(TCP/IP) to serve billions of users worldwide. It is a network of networks
that consists of millions of private, public, academic, business, and
government networks, of local to global scope, that are linked by a broad array
of electronic and optical networking technologies.
Internet Explorer (IE) – Internet browser designed by
Microsoft.
JavaScript - An implementation of the
ECMAScript language standard and is typically used to enable programmatic
access to computational objects within a host environment.
MySQL - A relational database management
system that runs as a server providing multi-user access to a number of
databases.
PHP
(Hypertext Preprocessor) - A widely used, general-purpose scripting language that was originally
designed for web development to produce dynamic web pages.
Ruby - A dynamic, reflective, general
purpose object-oriented programming language that combines syntax inspired by
Perl with Smalltalk-like features.
Room Report – Schedule of times when a room, lab,
or the Computer Science Library is booked, by a class or group, on a given day
of the week.
Spiral Model - A software development process
combining which elements of both design and prototyping-in-stages, in an effort
to combine advantages of top-down and bottom-up concepts.
Waterfall
Model (Classic) - The
Classic Waterfall Model is a
sequential software development model in which development is seen as flowing
steadily downwards (similar to a waterfall) through the phases of requirements
analysis, design, implementation, testing, integration, and maintenance.
WinZip - A proprietary file archiver and
compressor for Microsoft Windows,
XHTML (eXtensible Hypertext Markup
Language) - A family of XML markup languages that mirror
or extend versions of the widely used Hypertext Markup Language (HTML), the
language in which web pages are written.
XML (Extensible Markup Language) - A set of rules for encoding
documents in machine-readable form.
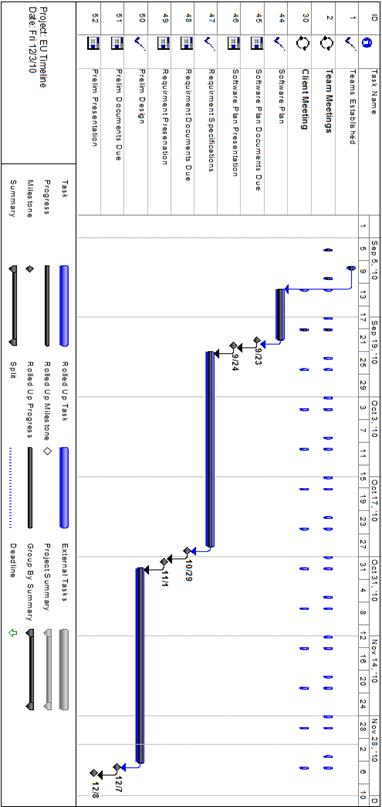
Appendix B: Project Timeline: Gantt Chart
Current
Timeline
First the
Current Timeline for this project will be displayed
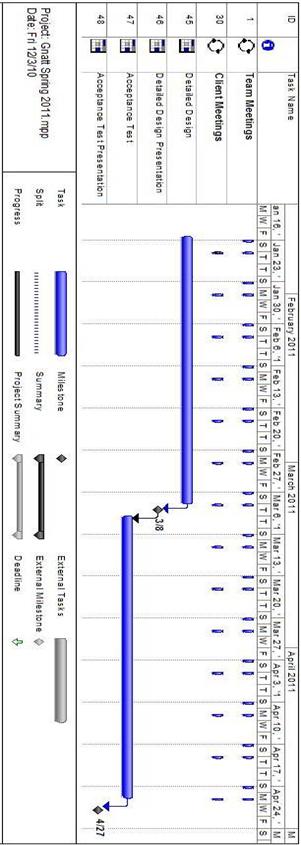
Future
Timeline
Second will
be the Future Timeline for the completion of the project
![]()
![]()
![]()
![]()